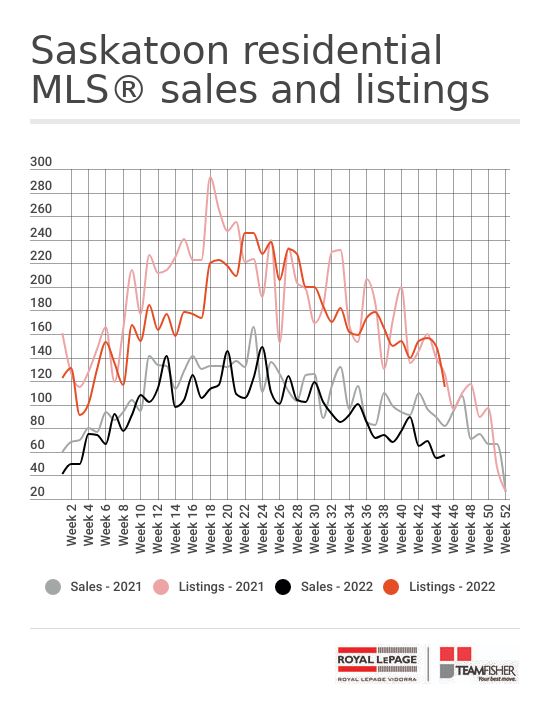
Sales numbers for the Saskatoon real estate market continued to come in towards annual lows with just 57 residential sales being reported to the multiple listing service®. That’s up from last week by two, but down from the same week last year by 25.
The new listing activity also waned, falling to its lowest level since the final week of January with just 115 Saskatoon homes being offered for sale on the MLS®. That number is lower than the previous week by 35, and down by 11 on a year-over-year basis.
It’s worth noting that the Saskatoon MLS® was closed for Remembrance Day on Friday. While that closure does not affect new listings, which are always uploaded by the seller’s brokerage, it does affect sales, which are always updated by the staff of the real estate association that provides the MLS service. In all likelihood, some of this week’s sales will go into next week’s numbers.

After falling lower for seven consecutive weeks, the inventory of active real estate listings in Saskatoon saw a slight upward tick. We close the week with 1115 residential listings available to buyers, up five from the previous week’s close, and lower annually by just 63.
Although inventory remains low it’s falling far slower than it typically would at this time of the year. It appears likely that over the next couple of weeks, we will find ourselves holding a greater number of listings than we did a year earlier.
As the week wrapped up, Saskatoon home buyers had a selection of 682 single-family homes, up just one from a week ago, and higher annually by 99 units. Condo inventory remained stable this week at 360 listings, down 161 from the close of the same week last year.
As expected, 30-day sales have been inching lower for about three months now. This week they took a large drop falling 24 units to slip below 300 for the first time since early this year. That number is now at 280.
Even with a slight growth in active listings, the drop in 30-day sales brought “months of inventory” (MOI) higher as two of the three categories we track officially landed in “balanced market” territory (inventory that would take four to six months to deplete based on current demand is considered to be in balance, where neither the buyer nor seller have a distinct advantage). Here’s what MOI looks like today.
All residential - 1115 active listings / 280 sales = 4.0 month supply (up 0.3 months from last week, and now in balance relative to demand).
Single-family homes - 682 listings / 174 sales = 3.9 month supply (up 0.2 months from last week).
Condos - 360 listings / 87 sales = 4.1 month supply. (up 0.5 months from last week and now in balance relative to demand).

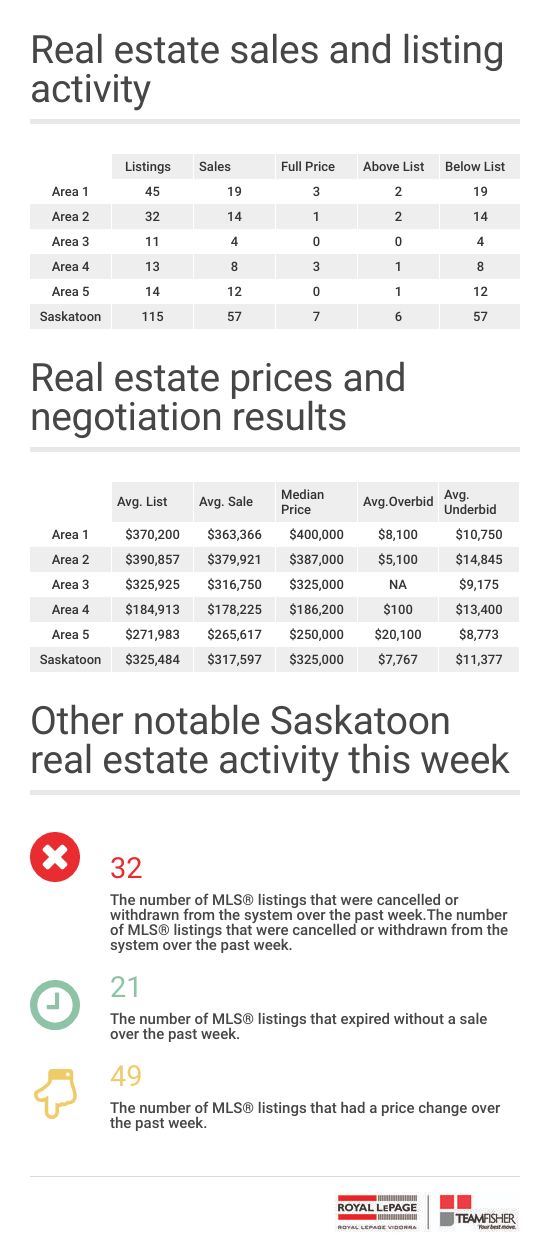
With just 10 percent of sales boasting a sale price above 500K both the weekly average sale price and the weekly median fell lower to $317,597 and $325,000 respectively.
With luxury home sales seeing a larger drop in sales than any other category, the six-week average price continued its slide, now for the seventh consecutive week. It slipped about four thousand dollars from last week to $347,000. That’s down just over 30K on an annual basis and its lowest point since August of 2021.

After reaching its lowest point since early January last week when the number of selling for more than the list price fell to zero, a few die-hards eager to put the home-buying experience behind them threw some cash around. Six sales showed a sale price that was higher than the list price this week. Meanwhile, 44 of 57 sales required some back-and-forth negotiations that resulted in sale prices that were, on average, $11,377 below the asking price.
Here is a breakdown of what the sales-to-listing price ratio looked like on this week’s sales. Please note that this chart may show over-list price sales, even when I have reported the number as 0. Those sales are typically new properties that spent some period of time on the market, and most likely sold and included additional improvements that were not reflected in the original list price. For example, a new home listed at $450,000 sells at a price of $490,000 after 120 days on the market may have included a basement development that was not anticipated in the listing price. We report these to you as “at list price sales”, which is likely too generous in some cases, but it’s simply not practical to obtain the full details of each sale. A description of the geographic boundaries of areas 1 through 5 is here.

More weekly stats and numbers for those who love them.

Follow me on Facebook and Instagram to receive updates on the Saskatoon real estate market and insights I've gained managing thousands of real estate transactions.
TeamFisher.com hosted over 520,000 user sessions last year and displayed more than 4.4 million pages to our visitors. If you have a Saskatoon area home you'd like to sell, we know how to get people looking at your home. Reach out to me directly to engage our team and learn about our processes.
I’m always happy to answer your Saskatoon real estate questions. Reach out by voice or text at 306-900-4161 or email me at norm at teamfisher.com
Norm Fisher
Royal LePage Vidorra
Comments:
Post Your Comment: