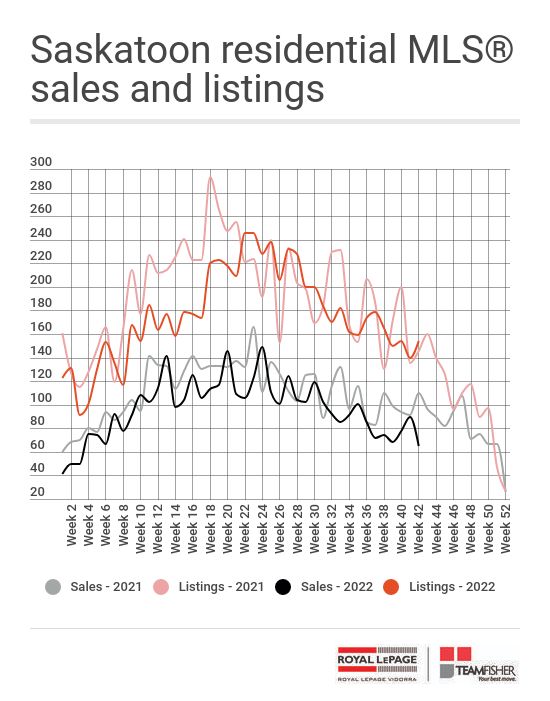
After two weeks of sales growth, Saskatoon home sales tumbled lower this week as local real estate agents reported just 65 firm sales to the multiple listing service®. That number marks a decline of 25 units compared to last week and it’s lower annually by 45. This isn’t a huge surprise, given the large number of sales posted over the previous two weeks, but still, it’s our weakest seven-day sales period since the third week of January.
Meanwhile, 154 new residential listings were added to the MLS® through the week, up 14 from last week and higher compared to the same period last year by eight.

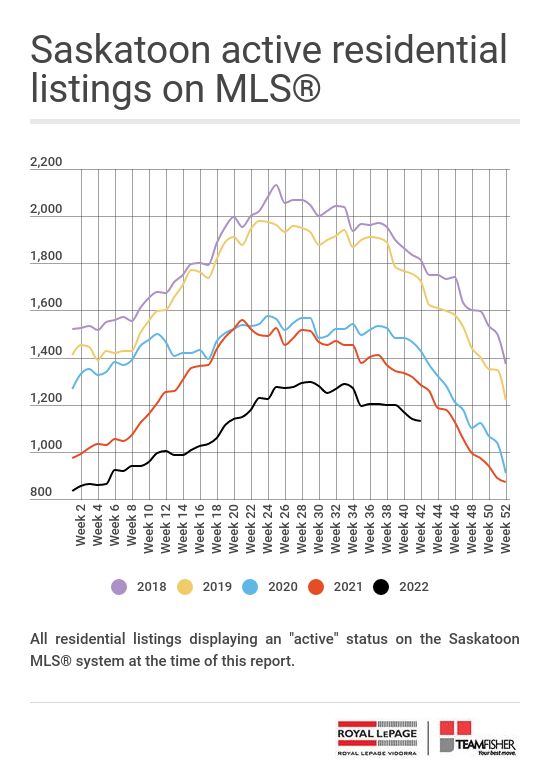
Even with the huge disparity between sales and new listings, canceled and expired listings pushed the number of Saskatoon homes for sale lower for the fifth consecutive week. We finish this period with 1129 active listings, down 12 from last week’s close and lower on a year-over-year basis by 141.
Today, Saskatoon home buyers can find 680 single-family homes for sale, five fewer than last weekend, and up annually by seven. There are 376 condominiums for sale, down seven from last week’s close, and well lower than the 529 units that were for sale at this time last year.
The number of homes to have sold over the past 30 days saw a small upward bump as that measure grew to 334 from 330 the week before. This moved “months of inventory” (MOI) slightly lower across the broader market for the second week in a row, while it remained stable across the two major types of housing. Here’s what MOI looks like today.
All residential - 1129 active listings / 334 sales = 3.4 month supply (down 0.1 months from last week).
Single-family homes - 680 listings / 208 sales = 3.3 month supply (the same as last week).
Condos - 376 listings / 108 sales = 3.5 month supply. (the same as last week).

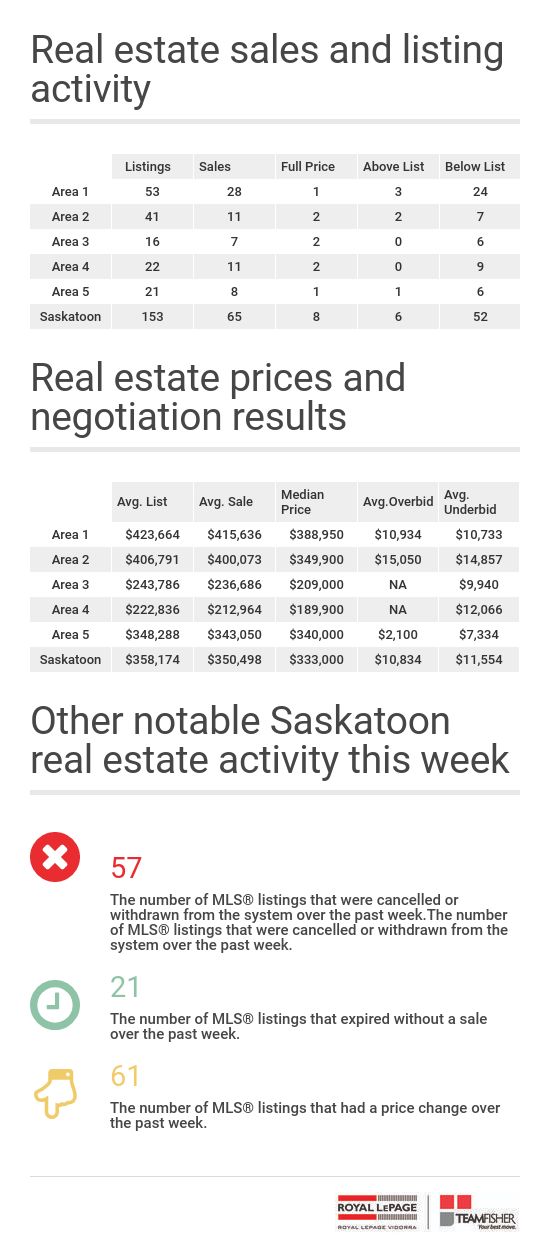
The luxury market remained quiet with just one sale posting a sale price above $650,000. With a third of all sales having sold below the quarter million dollar mark, the median price for the week remained low. It came in at $333,000. The weekly average grew modestly to $350,498.
Looking at prices over a bit of a longer term, we see the six-week median price edge lower for the fourth consecutive week. It closed the period at $353,080 down a bit more than 4K from last week and lower annually by more than seven thousand dollars. It’s now at its lowest point since late March of this year.
The four-week median price continued its downward slide, now for the eighth week in a row. It closes the week at $322,500 for a weekly drop of thirty-five hundred dollars and lower than it was a year ago by $38,500. This is its lowest point for any week since the third week of February in 2021 before the market ramped up for the spring. Again, this is a clear indication that the upper-end market has softened significantly, partly due to fewer options in the inventory, and further impacted by rising interest rates.
So, why are prices tumbling in what can still only be described as a seller's market? Let's break it down.
Home sales reported between September 1 and October 21 of this year are lower than they were over the same period last year by 23 percent.
Meanwhile, sales of homes with prices of $700,000 or more have fallen sharply. They're down 43 percent for the period.
More importantly, we see a massive increase in activity when it comes to sales of homes priced below $250,000. Even as sales across the broader market have slipped 23 percent, sales in the lower-priced category have spiked higher by 23 percent.
This shift is largely due to interest rate hikes and eroding affordability, and it's leading to lower average and median sale prices, even as the price of a specific property has hardly changed.

Once again, five lucky sellers managed to close a sale for more than they had been asking. Those sellers broke away with an average bonus of $10,834 but the bulk of the winnings went to two of the five sellers, while the other three saw a token overbid. Another eight homes attracted a full-price offer, while 52 of this week’s sales reported a price that was below the asking price by an average of $11,554.
Here is a breakdown of what the sales-to-listing price ratio looked like on this week’s sales. Please note that this chart may show over-list price sales, even when I have reported the number as 0. Those sales are typically new properties that spent some period of time on the market, and most likely sold and included additional improvements that were not reflected in the original list price. For example, a new home listed at $450,000 sells at a price of $490,000 after 120 days on the market may have included a basement development that was not anticipated in the listing price. We report these to you as “at list price sales”, which is likely too generous in some cases, but it’s simply not practical to obtain the full details of each sale. A description of the geographic boundaries of areas 1 through 5 is here.

More weekly stats and numbers for those who love them.

Follow me on Facebook and Instagram to receive updates on the Saskatoon real estate market and insights I've gained managing thousands of real estate transactions.
TeamFisher.com hosted over 520,000 user sessions last year and displayed more than 4.4 million pages to our visitors. If you have a Saskatoon area home you'd like to sell, we know how to get people looking at your home. Reach out to me directly to engage our team and learn about our processes.
I’m always happy to answer your Saskatoon real estate questions. Reach out by voice or text at 306-900-4161 or email me at norm at teamfisher.com
Norm Fisher
Royal LePage Vidorra
Comments:
Post Your Comment: